
설치 환경
- M1 MacBook Air, UTM
- OS: Rocky9버전
- Prometheus: Latest 버전
UTM에 Rocky Linux VM을 올려서 Prometheus를 설치하고자 한다.
설치는 Prometheus 공식 Docs를 보고 설치한다.
* Install: https://prometheus.io/docs/prometheus/latest/getting_started/
* File Download: https://prometheus.io/download/
1. 설치 파일 다운로드
위 File Download 링크에서 설치 환경(OS)에 맞는 압축 파일을 우클릭 → 링크 주소 복사를 한다.
그리고 VM에서 wget 명령어를 사용하여 파일을 다운 받는다.
* 본인이 사용하는 OS와 Architecture 잘 확인해서 다운받기~
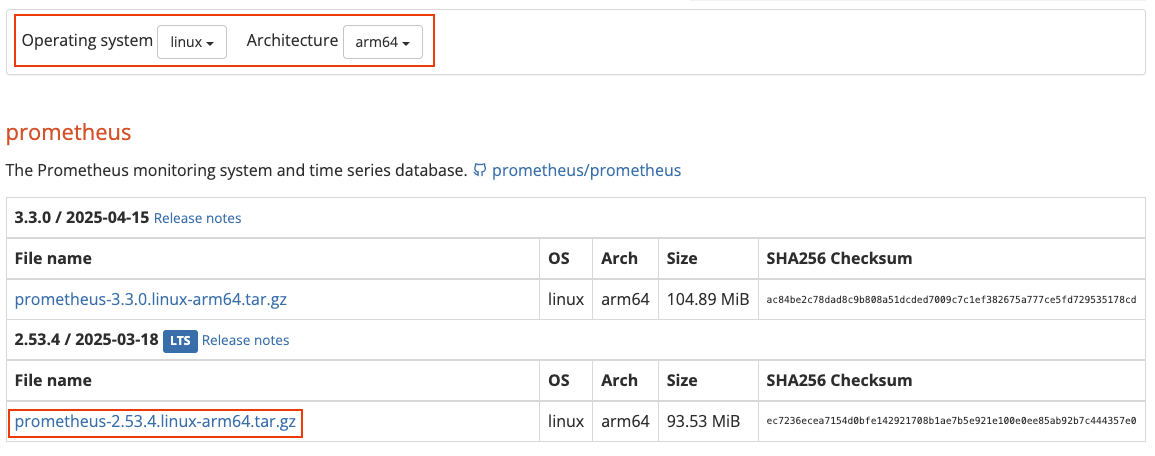
wget https://github.com/prometheus/prometheus/releases/download/v2.53.4/prometheus-2.53.4.linux-amd64.tar.gz
ls로 확인해보면 다운이 잘 된 것을 확인할 수 있다. (파일 용량까지 함께 확인하는 편)
[hee@Prometheus ~]$ ls -al prometheus*
-rw-r--r--. 1 hee hee 104200835 Mar 19 00:12 prometheus-2.53.4.linux-amd64.tar.gz
2. 압축 해제
tar 명령어로 압축 파일을 해제하고 디렉터리도 이동한다.
tar xvfz prometheus-*.tar.gz
cd prometheus-2.53.4.linux-amd64/
Prometheus 구성
Prometheus 설치를 하기 전에 구성을 한 번 먼저 확인해본다.
공식문서에 보면 아래와 같이 나와있다.
"Prometheus는 HTTP 엔드포인트에서 메트릭을 스크래핑하여 대상의 메트릭을 수집합니다.(Prometheus collects metrics from targets by scraping metrics HTTP endpoints.)"
HTTP 엔드포인트를 설정하는 파일이 prometheus.yml이다.
프로메테우스가 설치된 서버에도 자신의 엔드포인트를 가지므로, 자신의 정보를 수집할 수 있다.
아래 configuration에 접속해보면, config 파일에 대해 설명이 있다.
* configuration: https://prometheus.io/docs/prometheus/latest/configuration/configuration/
yml 파일에 있는 기본적인 내용부터 확인 해보려고 한다.
✓ 기본적으로 Alertmanager configuration에 관련된 부분이 있는데, 당장 Alert을 수신할 건 아니라서 일단 제거함.
(압축 파일에 있는 yml과 Docs에 있는 yml이 조금 다르던데, 압축 파일에 있던 yml을 기준으로 사용)
# my global config
global:
  scrape_interval: 15s    # Target 시스템으로 부터 메트릭을 읽어오는 주기
# Target으로 부터 읽어 온 메트릭을 기반으로 Rule에 따라 Alert을 보낼 수 있음.
  evaluation_interval: 15s    # Alert을 보낼지 말지 메트릭을 보고 판단하는 주기

# 수집 정보 설정, Target의 Endpoint를 설정(데이타 수집 대상과 방법을 정의)
# Prometheus 본인 서버 정보를 수집

scrape_configs:
  # job_name은 시계열 데이터 수집 시, 'job=<job_name>'으로 라벨 추가
  - job_name: "prometheus"

    # metric의 기본 경로는 '/metrics'
    # scheme는 metric을 수집할 때 사용할 기본 프로토콜은 'http'.

    static_configs:
      - targets: ["localhost:9090"]
Prometheus 실행
구성파일(prometheus.yml)로 프로메테우스를 시작한다.
구성파일이 있는 경로에서 아래 명령어를 실행
./prometheus --config.file=prometheus.yml

공식문서에 보면, 기본적으로 Prometheus는 ./data 밑에 데이터를 저장한다.
만약 경로를 변경하고 싶다면, --storage.tsdb.path 옵션을 사용하면 된다.
./prometheus --config.file=prometheus.yml --storage.tsdb.path=<Path>
<사담>
실행하자마자 binary가 다르다고 error을 뱉어서 뭐지 하고 보니까 OS는 ARM64인데, 나는 AMD64로 다운받음;
파일을 다운 받을 때는 좀 잘 보고 하기..!!
[hee@Prometheus prometheus-2.53.4.linux-amd64]$ ./prometheus --config.file=prometheus.yml
-bash: ./prometheus: cannot execute binary file: Exec format erro

웹에 localhost:9090이나, 나는 IP:9090으로 실행하였고 웹 페이지가 잘 뜬 것을 확인했다.

EndPoint 확인
Status → Targets 경로로 가면 endpoint 상태와 Label을 확인할 수 있다.
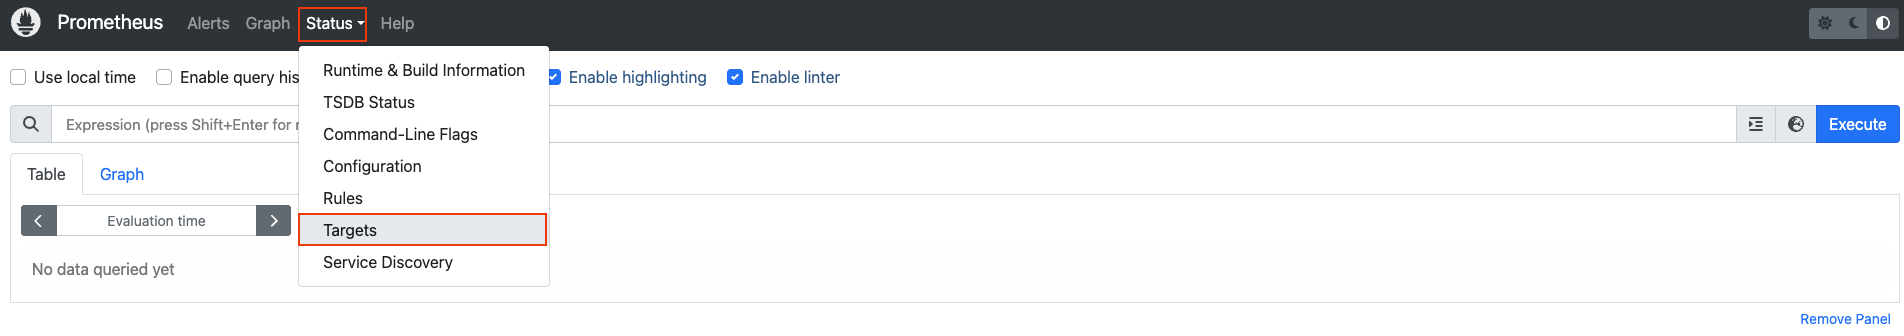
아래 Endpoint를 보면 localhost:9090/metrics로 자기 자신 서버의 정보를 수집하는 것을 확인 할 수 있다.

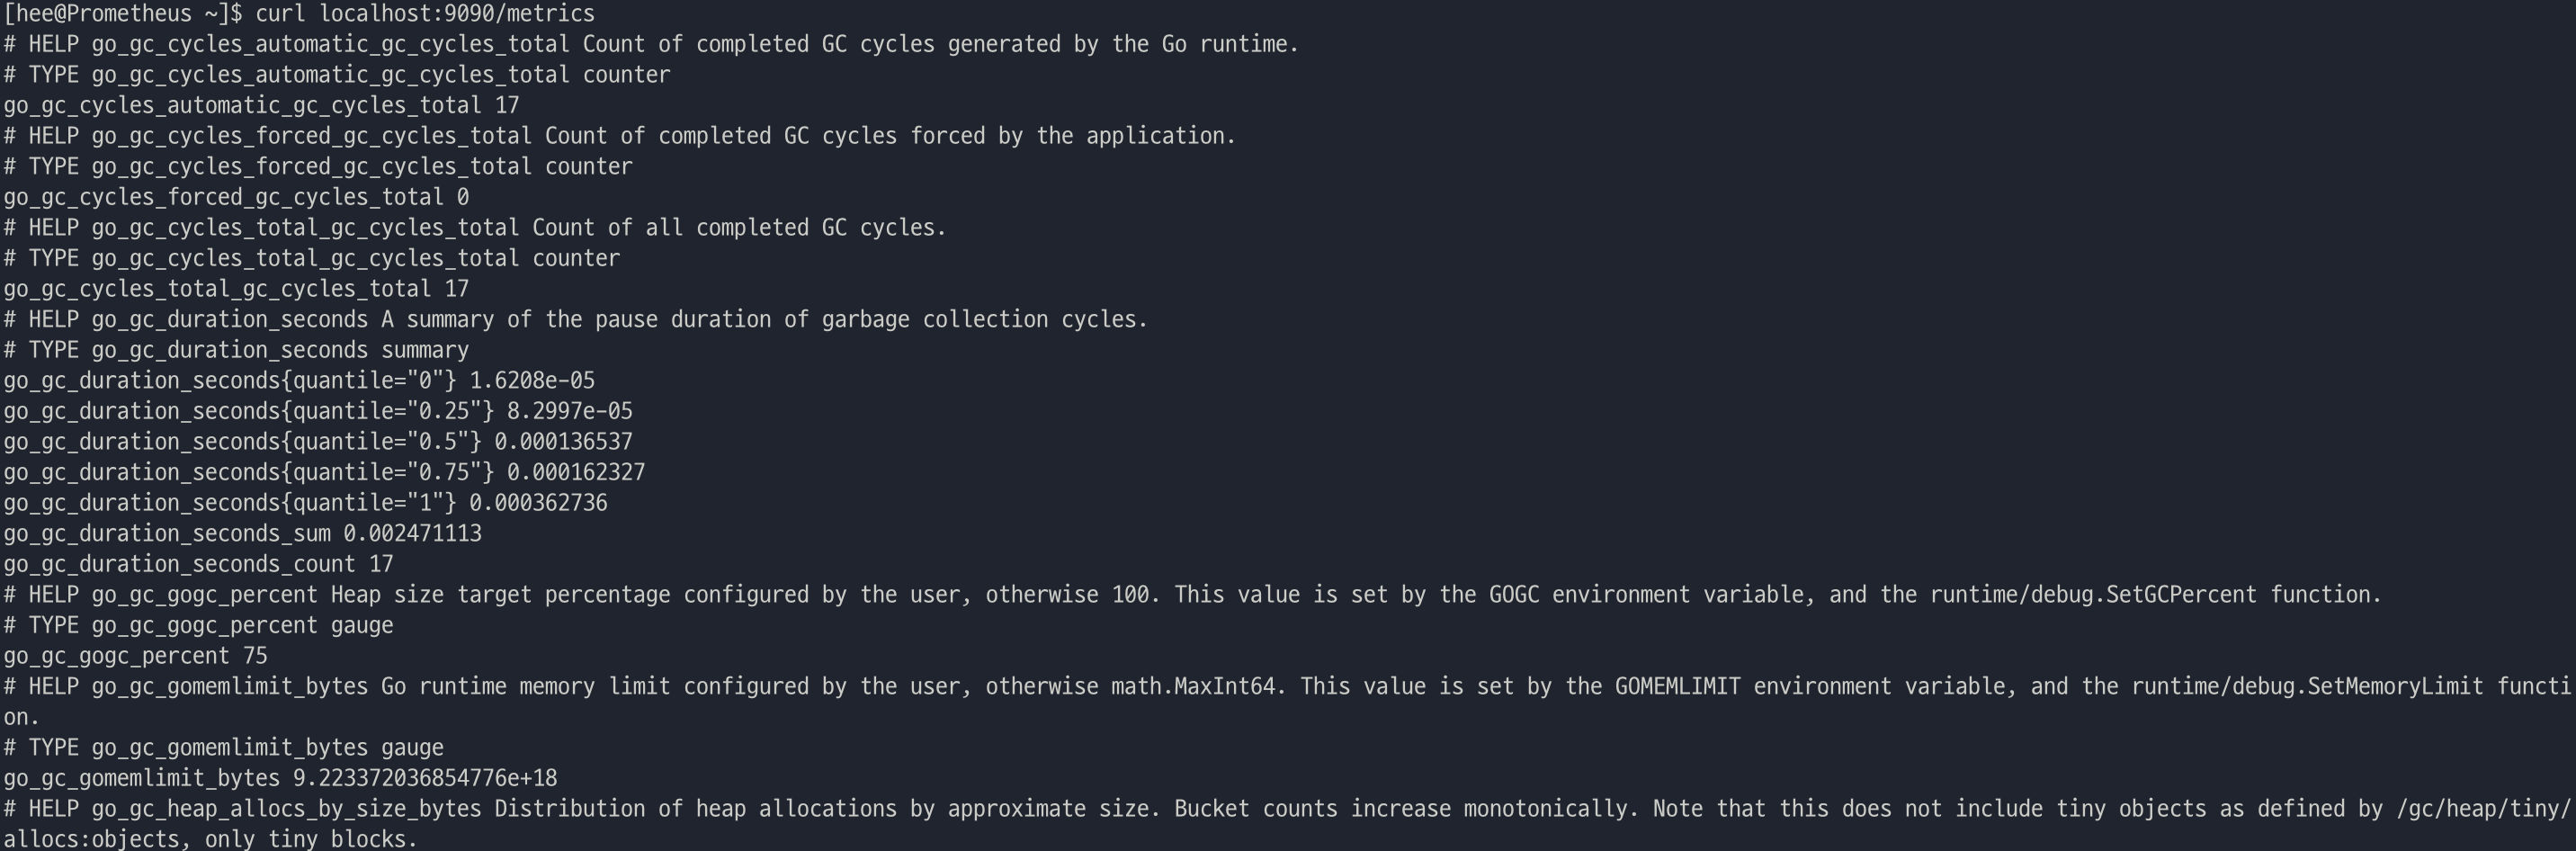
터미널에서 localhost:9090/metrics로 curl을 날리면, 수 많은 메트릭 정보들을 볼 수 있다.
각 정보들은 메트릭(key)에 대한 수집된 값(value)로 구성되어 있다.
PromQL
localhost:9090/graph 경로로 접속하여 Prometheus Query(PromQL)를 사용할 수 있다.
공식 Docs에 나와있는 Prometheus가 Target 서버에서 데이터를 수집하는데 걸리는 시간을 확인하는 쿼리를 실행해 보았다.
prometheus_target_interval_length_seconds
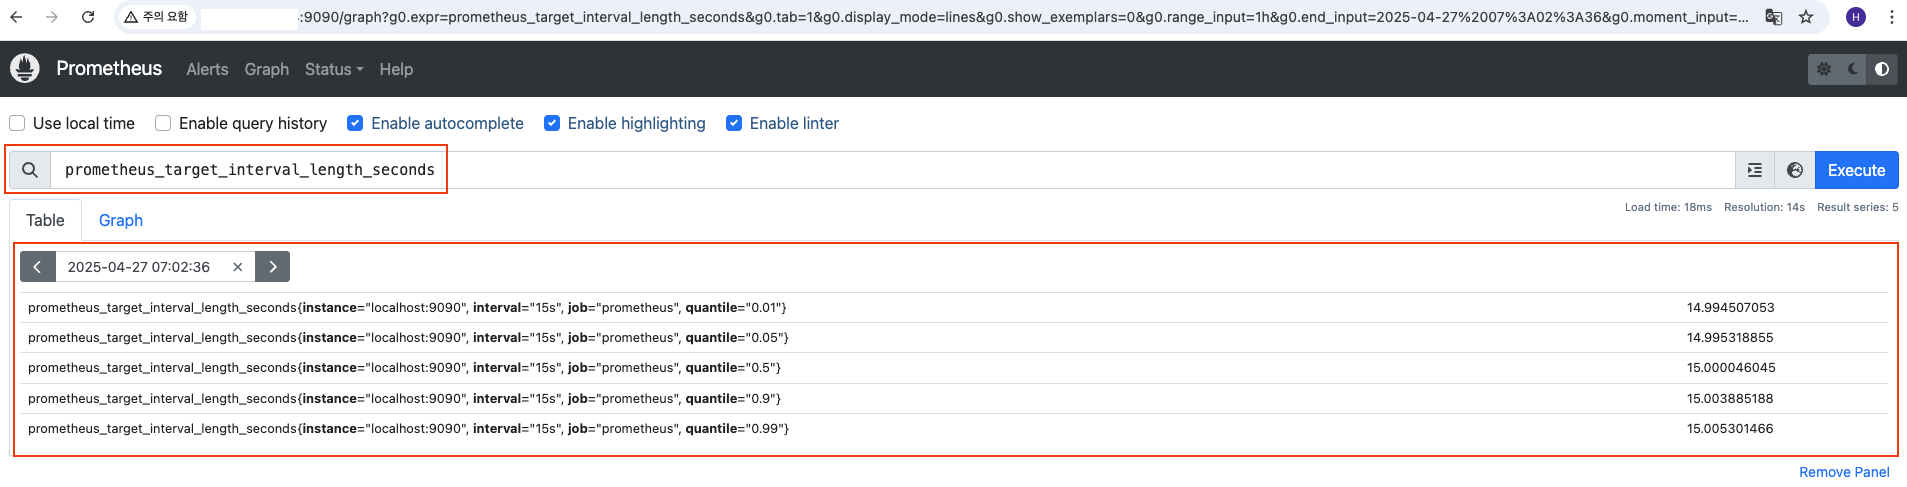
Target 서버의 최신 데이터와 Label(instance="localhost:9090",job="prometheus")을 확인 할 수 있다.
Target 서버가 여러 개 있었으면 각 데이터에 맞는 값이 보였을 것이다.
prometheus_target_interval_length_seconds{quantile="0.99"}
99번째 백분위 지연 시간을 확인하고 싶은 경우 위 쿼리를 사용할 수 있다.

Query에 대한 내용은 아래 공식 Docs에서 확인할 수 있다.
- Querying: https://prometheus.io/docs/prometheus/latest/querying/basics/
Query는 Console 옆에 지구본(🌎) 모양을 누르면 엄청 다양한 Query가 있는 것을 확인할 수 있다.
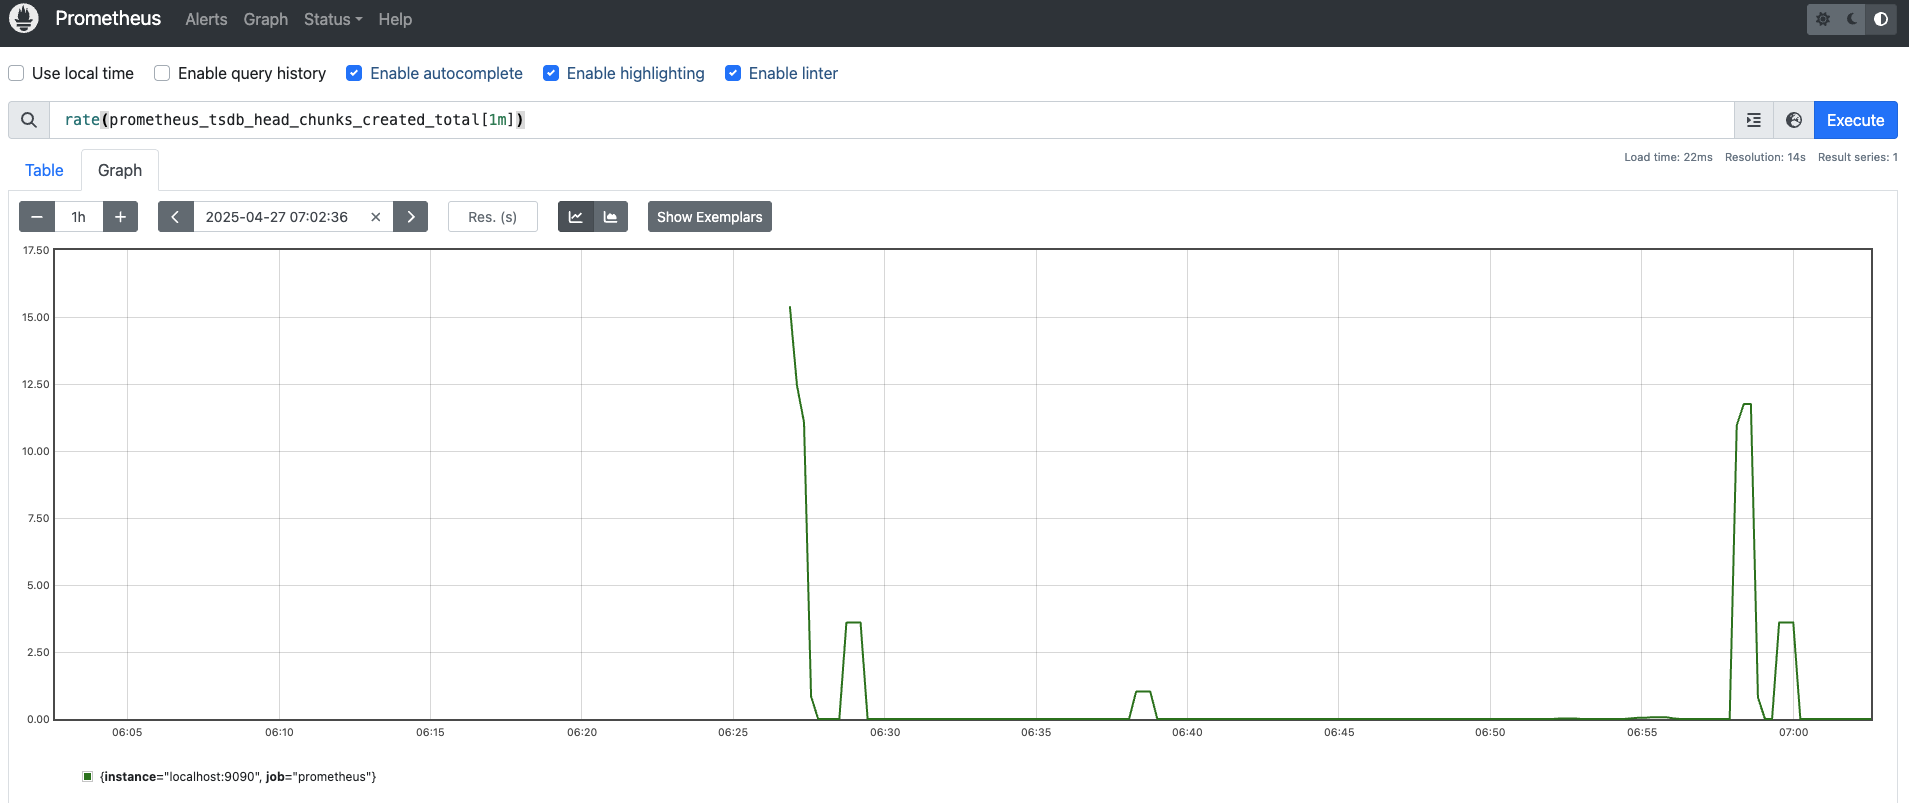
Graph Interface
localhost:9090/graph에서 Graph 탭에서 그래프를 볼 수 있다.
공식 Docs에 예시로 나와있는 Query를 실행해서 그래프를 확인했다.
(Prometheus에서 생성되는 chunk의 속도를 그래프로 만드는 식)
rate(prometheus_tsdb_head_chunks_created_total[1m])
여기서도 동일하게 지구본(🌍) 모양을 클릭하면 다양한 Query를 확인할 수 있다.
Query를 보다가 CPU 관련된 것이 보여서 해당 쿼리를 실행해 보았다.
process_cpu_seconds_total: 사용자 및 시스템 모드에서의 프로세스 CPU Time.

노트북에서 여러 VM을 올리기에는 힘들어서, PC에 다시 VM 올려서 데이터 수집을 이것저것 해보면서 익숙해져야 할 것 같다.